Drop a chrome://webrtc-internals dump and get E-model MOS scores,
per-second call timelines, quality trends across all your calls, and AI root-cause diagnosis —
running 100% inside your own Databricks workspace. Zero external egress.
chrome://webrtc-internals のダンプをドラッグ&ドロップするだけで、E-model MOSスコア、
秒単位の通話タイムライン、全通話の品質傾向、AIによる根本原因診断まで——
すべてあなたのDatabricksワークスペースの中で完結。外部送信ゼロ。

Why teams pick it
選ばれる理由
No external domains declared, no telemetry collected. TURN credentials are redacted and SDP bodies dropped at parse time. Works with Meet, Teams, or your own WebRTC app.
外部ドメインの宣言なし、テレメトリ収集なし。TURN認証情報はパース時に秘匿化し、 SDP本文は破棄。Meet、Teams、自社WebRTCアプリのいずれでも使えます。
W3C getStats-compliant medallion schema in your Unity Catalog. JOIN call quality with your business data, copy any view's SQL into the SQL editor, or use the bundled AI/BI dashboard.
W3C getStats準拠のメダリオンスキーマがあなたのUnity Catalogに。ビジネスデータとJOINする、 各画面のSQLをそのままSQLエディタで使う、同梱のAI/BIダッシュボードで見る——すべて自由です。
ITU-T G.107 E-model scoring per stream, 10-second window, and session. One click asks a foundation model in your workspace for a diagnosis that cites the evidence.
ITU-T G.107 E-modelで、ストリーム・10秒ウィンドウ・セッションの3粒度でスコアリング。 ワンクリックで、ワークスペース内の基盤モデルが証拠を引用した診断を返します。
Product tour
プロダクトツアー
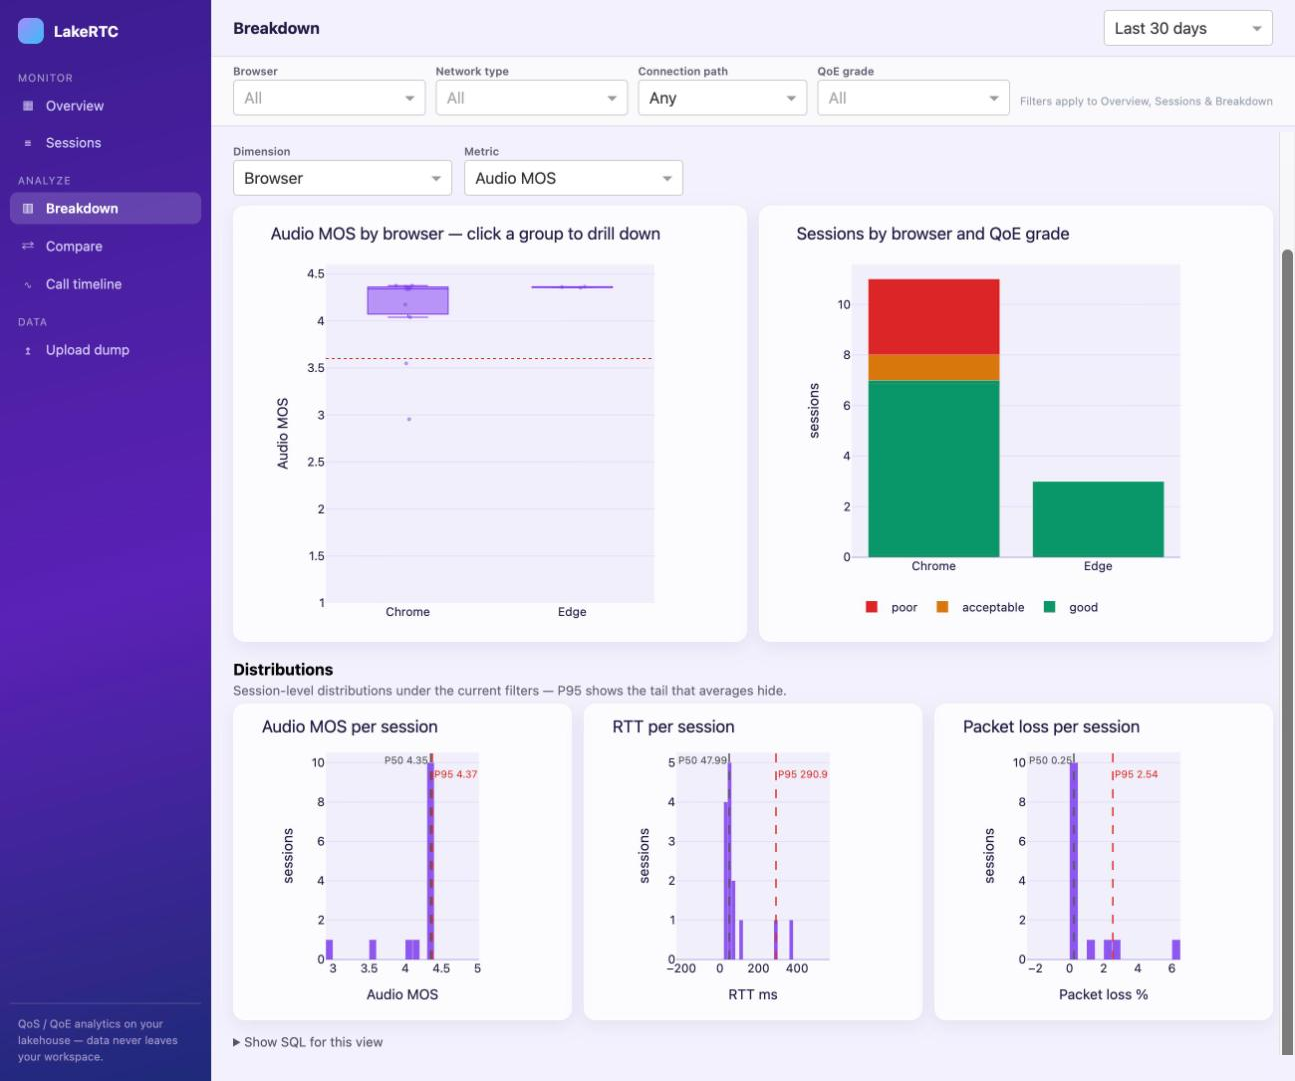
Slice MOS, loss and RTT by browser, OS, network type, TURN usage, weekday or hour — box plots with per-group drill-down, and P50/P95 histograms that show the tail your averages hide.
MOS・パケットロス・RTTをブラウザ、OS、ネットワーク種別、TURN利用、曜日・時間帯で分解。 グループクリックでドリルダウンできる箱ひげ図と、平均が隠すテールを見せる P50/P95ヒストグラム。
Two sessions side by side: metric deltas in a table, full timelines below. The degraded intervals light up on one side and not the other — that difference is usually your answer.
2つのセッションを並列表示。上に指標の差分表、下にフルタイムライン。 片側だけ劣化区間が赤く光る——その差分が、だいたい答えです。
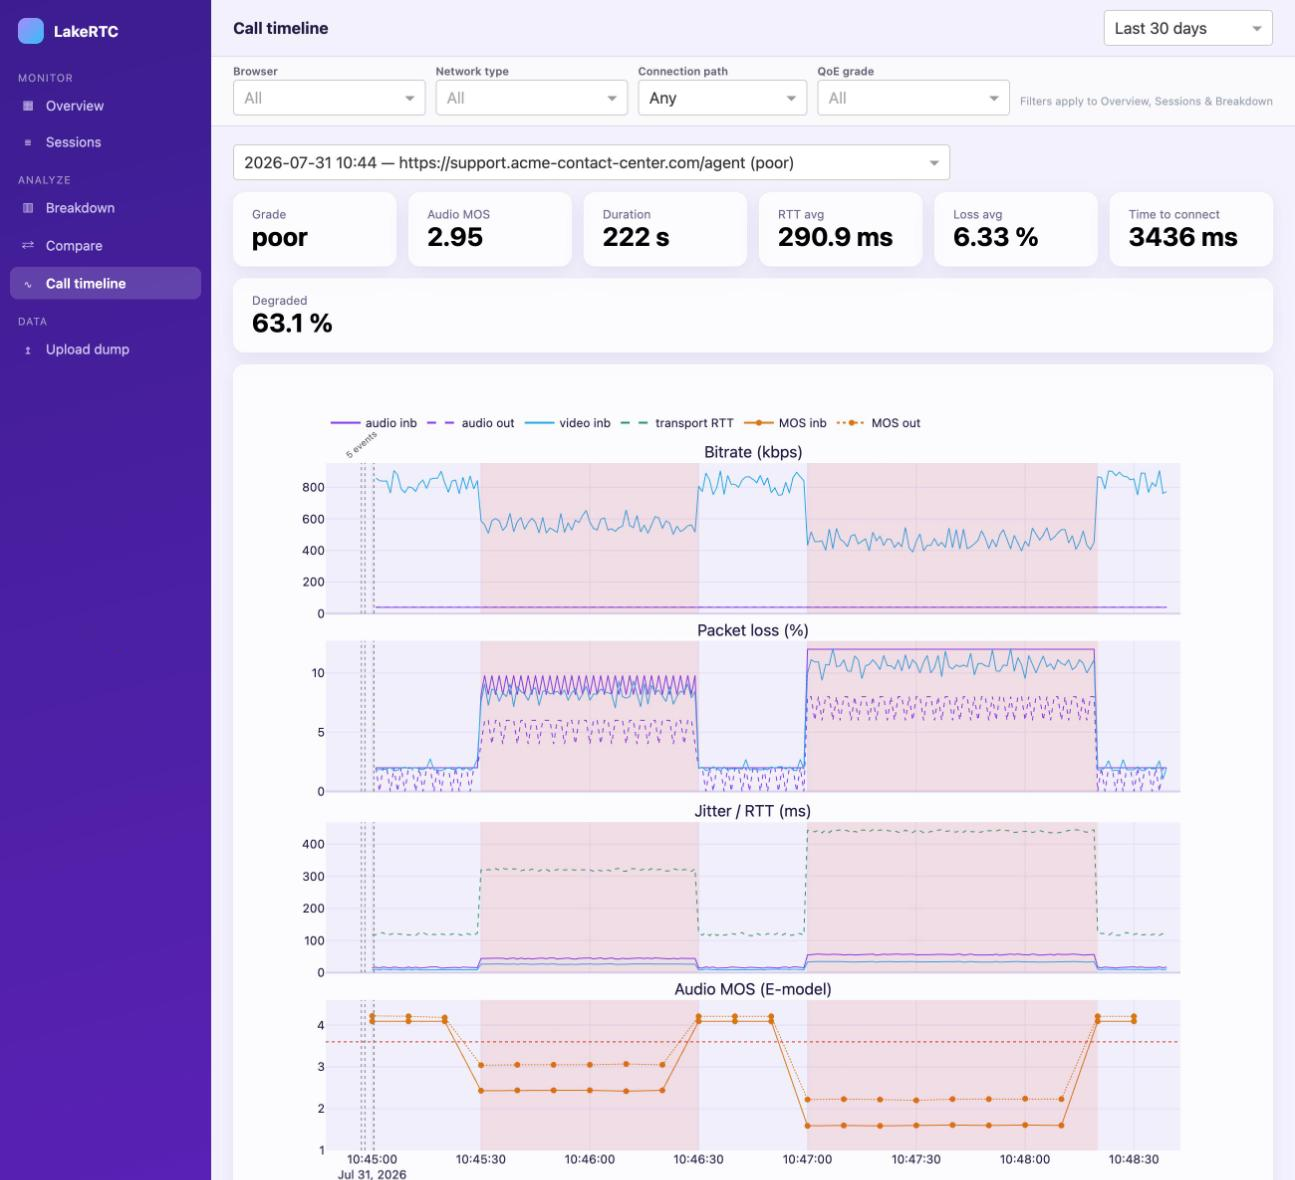
Bitrate, loss, jitter/RTT and MOS at one-second resolution, with ICE and connection events overlaid and degraded windows shaded. Setup bursts are clustered so the chart stays readable.
ビットレート、パケットロス、ジッター/RTT、MOSを1秒刻みで表示。ICEや接続イベントを重ねて描き、 劣化した区間はひと目でわかるように色付けします。セットアップ時に集中するイベントは 自動でまとまるので、チャートは最後まで読みやすいまま。
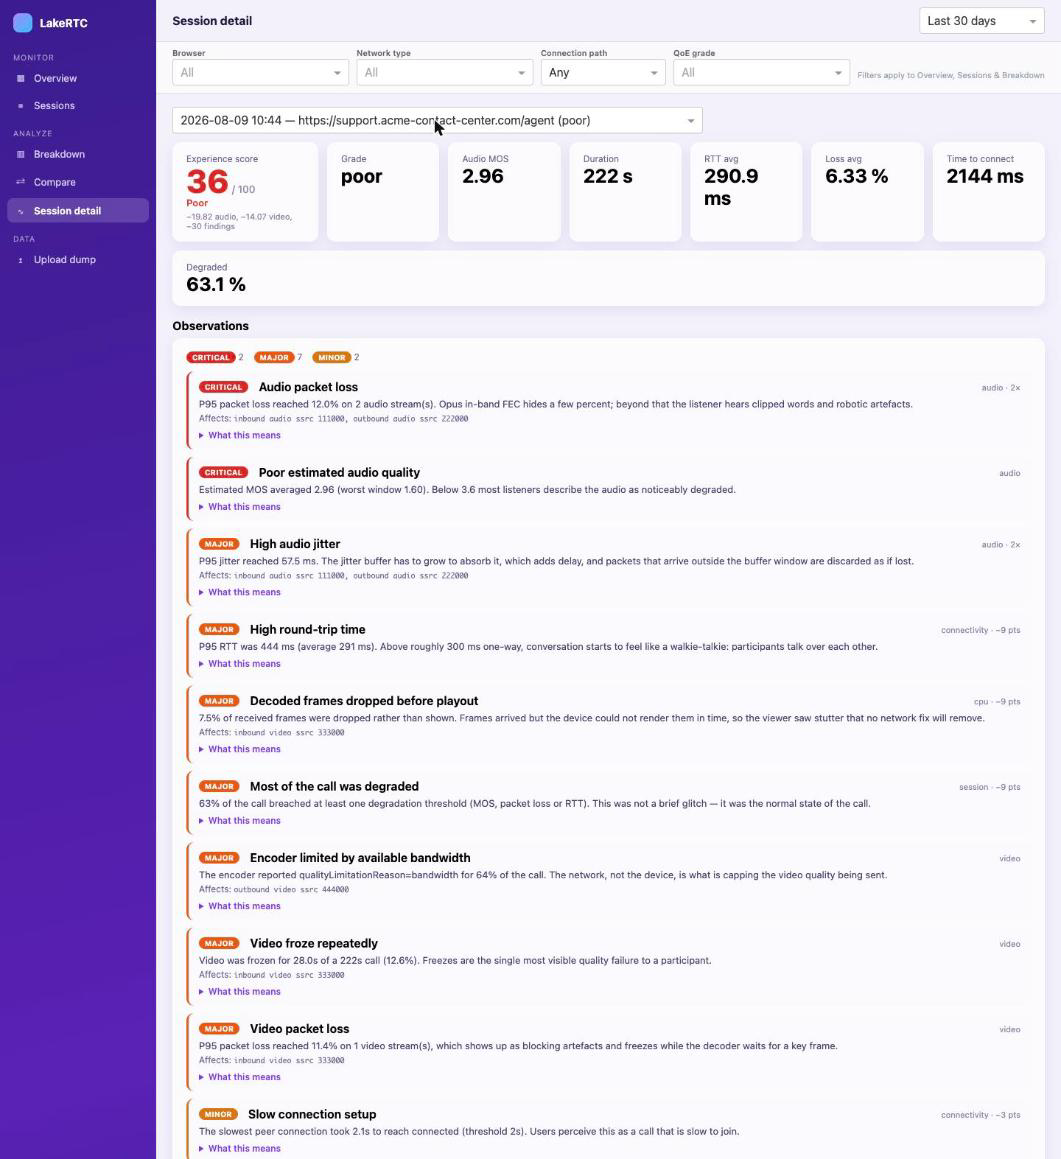
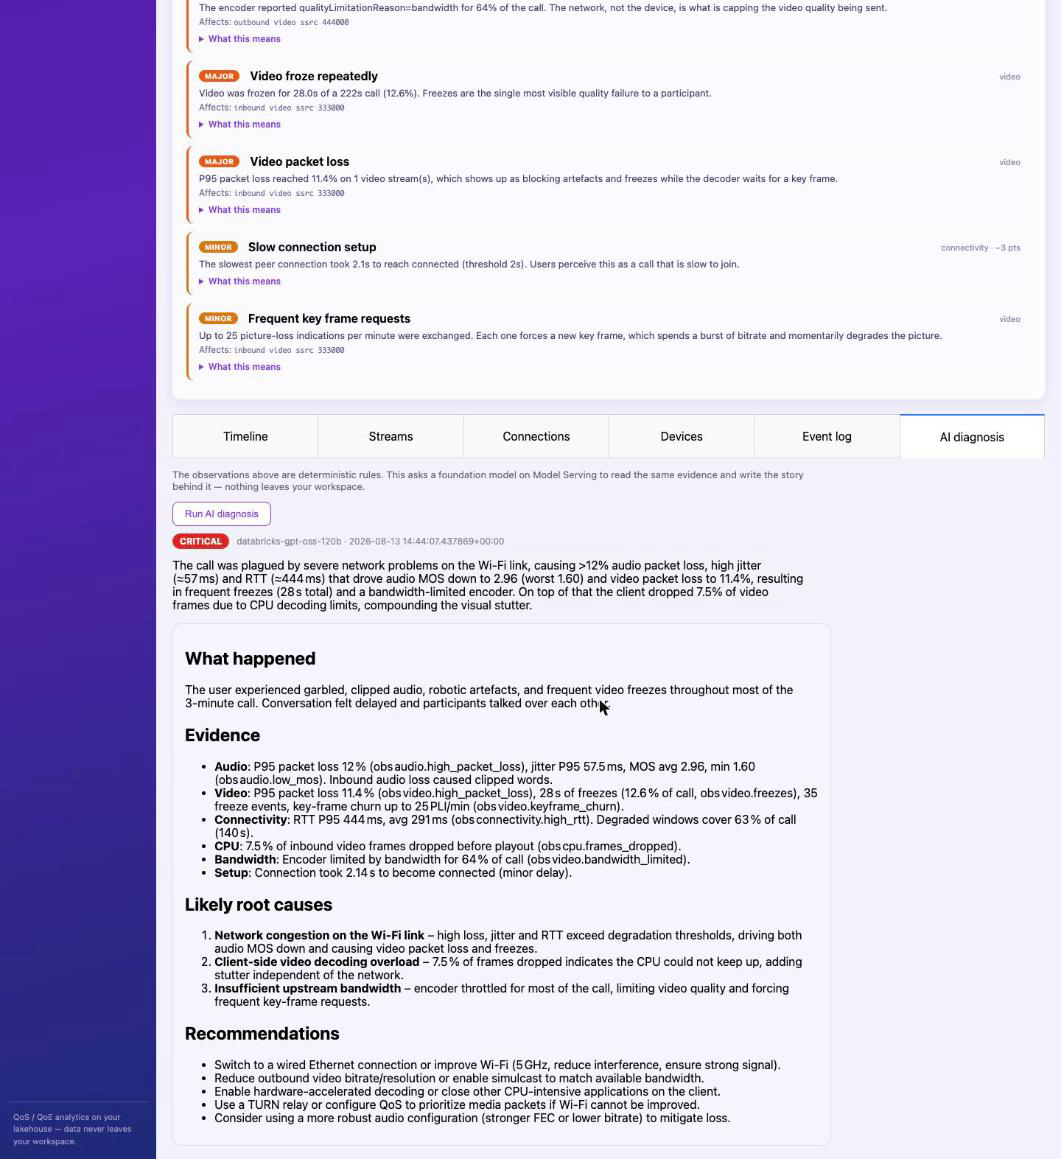
Severity, what happened, evidence with concrete numbers, likely root causes and recommended actions — generated by a foundation model running in your workspace, stored as history next to your data.
深刻度、何が起きたか、具体的な数値つきの証拠、根本原因の候補、推奨アクション—— ワークスペース内で動く基盤モデルが生成し、データの隣に履歴として保存されます。
How it works
使い方
The listing is free. Point the app at your SQL warehouse and a pay-per-token model endpoint, run the bundled DDL, and you're set — no new infrastructure to stand up.
利用は無料。SQLウェアハウスとモデルエンドポイントを選んで、 同梱のDDLを流せばセットアップは終わりです。新しいインフラは何も増えません。
Notice a call that felt off? Save the dump from chrome://webrtc-internals, drag it into the app, and everything from parsing to QoE scoring runs on its own — no SDK to embed first.
「今の通話、変だったな」と思ったら chrome://webrtc-internals を保存して、 アプリにドラッグ。あとはQoEスコアの算出まで自動で終わります。SDKの組み込みを待つ必要はありません。
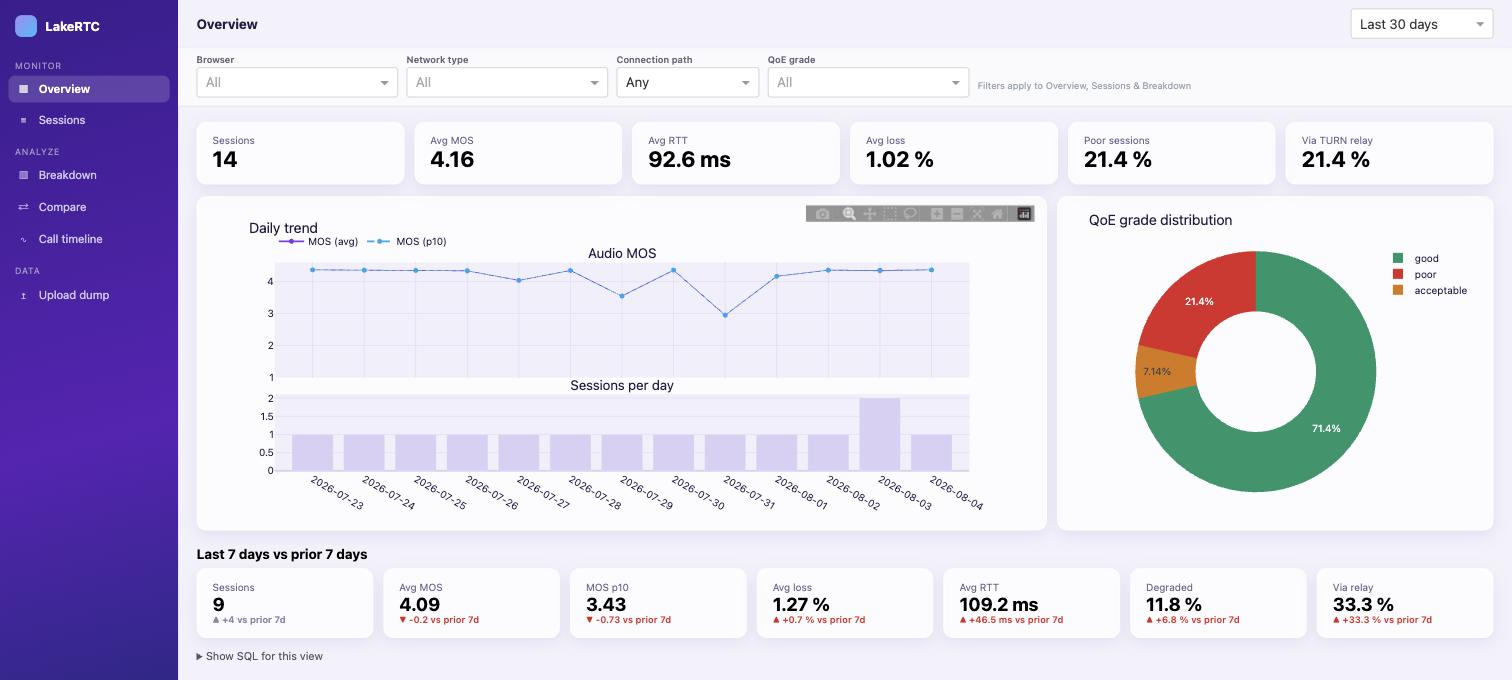
Start with a bird's-eye view of every call. When one looks suspicious, drill into its per-second timeline — or just ask the AI why it was bad, in one click.
まず全通話の調子をひと目で。怪しい通話が見つかったら、秒単位のタイムラインで 掘り下げるもよし、ワンクリックでAIに「なぜ悪かったのか」を説明させるもよし。
Roadmap: a TypeScript collection SDK for continuous monitoring feeds the exact same tables — everything you build on the gold schema today keeps working.
ロードマップ: 継続監視のためのTypeScript収集SDKは同一のテーブル群に 書き込みます——goldスキーマの上に今日作ったものは、そのまま動き続けます。
Built for
こんなチームに
Want early access, a demo with your own dumps, or a heads-up when the listing goes live? One email is enough.